The Lampkin for Ontario campaign has launched a new public-records transparency tool designed to help residents explore development activity, understand how decisions are made, and trace information back to official City of Ontario sources.
For weeks, the Lampkin for Ontario campaign has been working on a simple question:
What would greater transparency at City Hall actually look like if residents had better tools?
Today, we are putting one answer into practice.
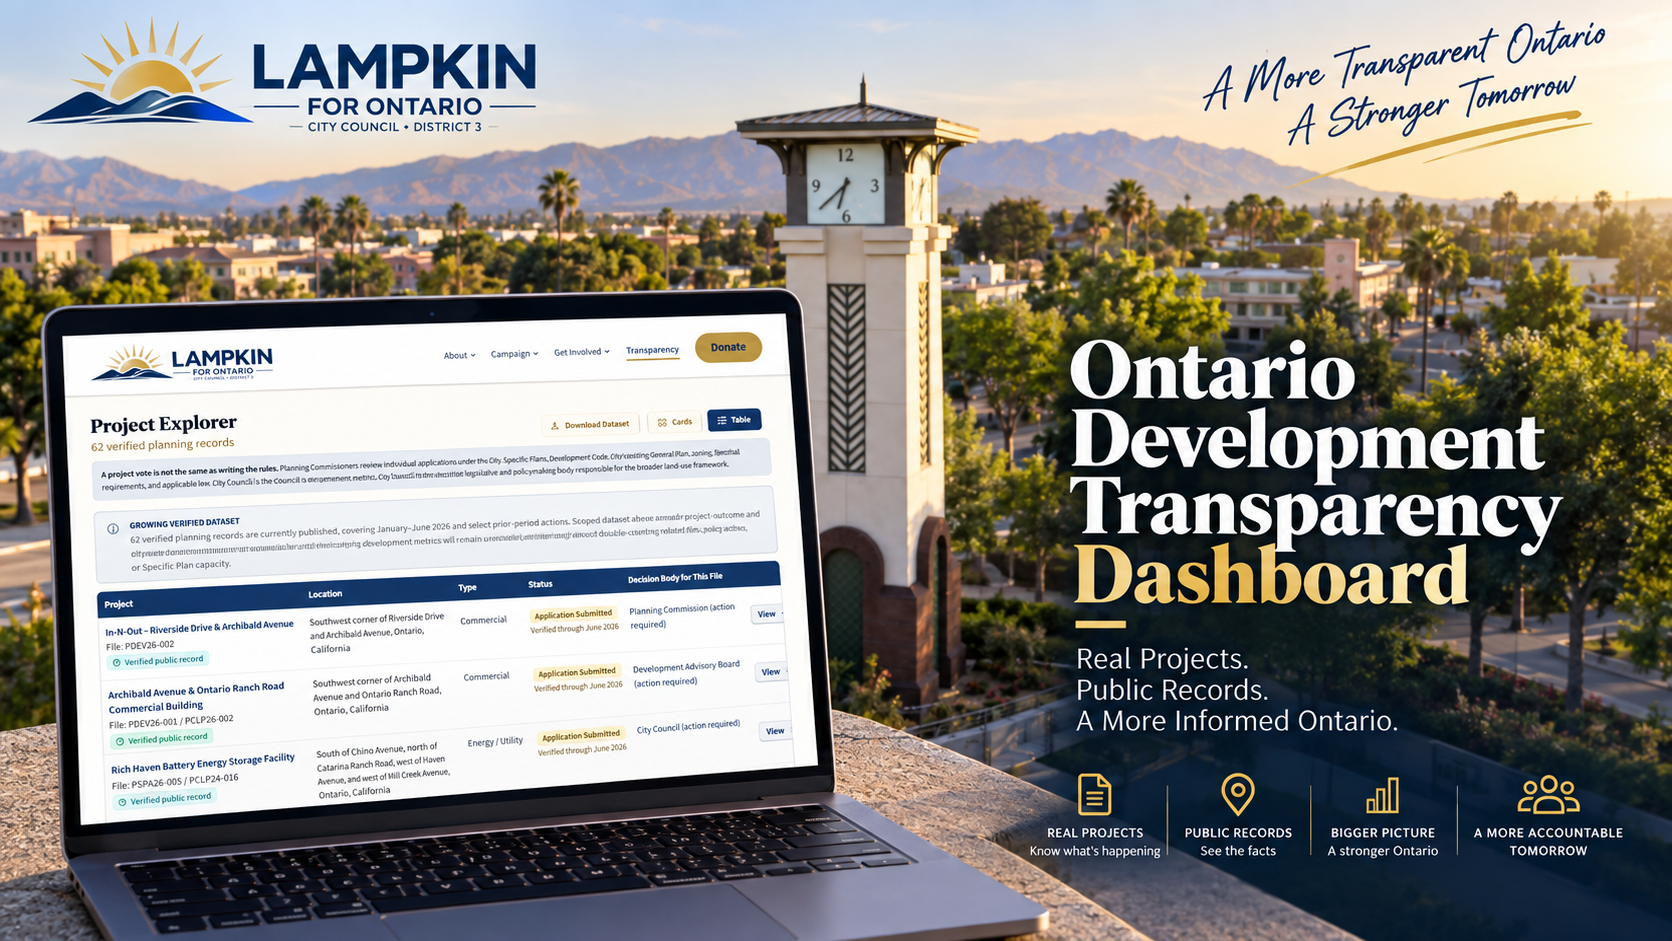
The campaign has launched the Ontario Development Transparency Dashboard, a new public-records tool designed to make it easier for residents to understand development activity across Ontario, trace individual planning records, and see the official documents behind the information.
The goal is straightforward: residents should not have to navigate dozens of agendas, staff reports, planning documents, and government webpages simply to understand what is happening in their community.
The dashboard brings those records together in one searchable place.
See the Records for Yourself
The first published version of the dashboard includes 62 verified planning records, covering substantive development and planning activity reviewed through June 2026 along with select prior-period actions connected to those records.
Residents can search and filter the dataset by project type, project status, City File Year, Council district, decision-making body, development topic, and other categories.
Each project record is designed to help answer basic questions residents often struggle to answer:
- What is being proposed?
- Where is it located?
- What type of development is it?
- What public body acted—or still needs to act—on the file?
- What is the current status?
- And where did the information come from?
Whenever possible, the dashboard connects residents directly to the official public records used to verify the information.
Don't take my word for it. Check the source.
Separating Facts From Assumptions
Development discussions can quickly become confusing.
A warehouse project, subdivision map, Specific Plan amendment, Development Agreement, conditional use permit, historic preservation action, and Citywide policy amendment are not the same thing.
Neither is a vote on an individual application the same as writing the broader rules governing development.
The dashboard was built to preserve those distinctions instead of collapsing everything into a single statistic.
For example, the dashboard's Warehouse / Logistics tools distinguish verified warehouse developments from manufacturing facilities, truck and trailer uses, environmental services, towing operations, and policy-only actions.
The housing section similarly distinguishes proposed units, approved units, prior-period approvals, and theoretical Specific Plan capacity.
Those distinctions matter when residents are trying to understand what is actually happening.
Transparency Also Means Saying What Is Not Yet Verified
The dashboard does not pretend every piece of information is complete.
Where a Council district assignment has not yet been sufficiently verified, the record remains listed as District Not Yet Verified rather than being assigned based on an approximation.
Of the current 62 records, 47 have verified district scope, while 15 remain under district verification because of boundary or location-specific questions.
Those projects remain fully visible.
That approach reflects an important principle behind the project: transparency is not simply publishing more information. It is also being clear about the limits of what has been verified.
A Working Example of What Is Possible
This dashboard was created by the Lampkin for Ontario campaign. It is not an official City of Ontario website and is not affiliated with or endorsed by the City.
That distinction is intentional.
Campaigns often talk about what they hope to accomplish if elected. This project is meant to demonstrate something different: what can already be built when transparency is treated as a practical responsibility rather than a slogan.
Residents deserve public information that is easier to search, easier to understand, and easier to verify.
The Ontario Development Transparency Dashboard is one example of what that can look like.
And it will continue to grow as additional official records are reviewed and verified.
Explore the Dashboard
Visit the Ontario Development Transparency Dashboard at www.lampkinforontario.org/transparency.
Search for a project you recognize. Explore the housing and warehouse data. Review the decision history. Follow the sources.
Because better government begins with residents being able to see how decisions are made.
A more transparent Ontario starts with giving people the information to participate.
Explore Topics
Written by
Lampkin for Ontario Campaign
Content creator and writer sharing insights and stories.